What is a yield curve?
The word yield stands for the profit or return that can be achieved by investing in bonds. can be achieved. The yield curve depicts these yields in a diagram . Dabei wird der Yield der Obligation in das Verhältnis zur Laufzeit der Obligation (Fälligkeit) gesetzt. Die Steigung der Kurve ist also ein Indikator für Zinsänderungen, die Wirtschaftstätigkeit und das Wachstum. Sehr beliebt ist hier zum Beispiel die Yield Curve von Staatsanleihen.
In general, the yield curve can take different forms. Normally, a longer term for bonds should lead to a higher yield, as the risk (e.g. credit risk) increases with the term. This therefore leads to a rising curve. However, there is also the case of the inverted yield curve and the flat yield curve. These two forms tend to occur in rare cases. As interest rates change over a period of time, there is a risk that this could be to the detriment of the investor. As a rule, the price of a bond falls when market interest rates rise, and vice versa. This risk is also known as yield curve risk.
Types of yield curves
The normal yield curve
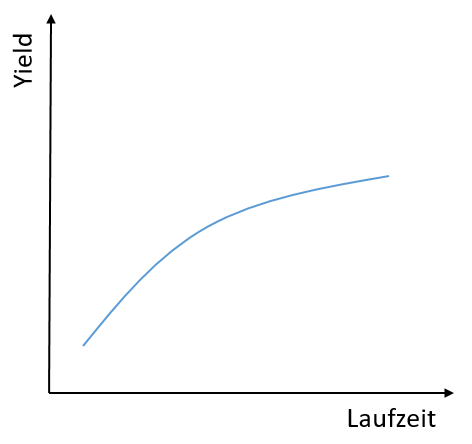
As already mentioned, the normal yield curve slopes upwards. The yields for bonds with curved maturities are therefore rather low and increase with maturity. A shorter term is generally associated with less risk (default risk, inflation risk) and therefore the yield is correspondingly lower. The illustration shows an example of a normal yield curve.

The inverted yield curve
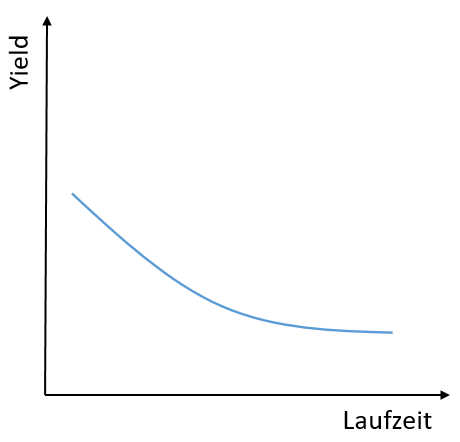
The yield curve only takes on this form in exceptional situations. The inverted yield curve arises when a bond with a short maturity pays a higher yield than a bond with a long maturity. The inverted yield curve is therefore tilted downwards. This shape of the yield curve indicates a recession. The central bank can also intervene in the system in times of inflation and thus create an inverted yield curve.

The flat yield curve
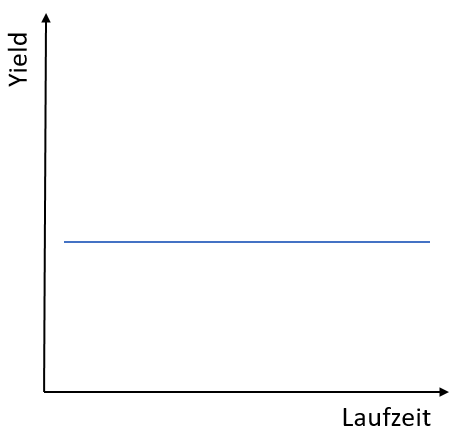
This form of yield curve also represents an exceptional situation. With a flat yield curve, the bonds have a similar yield over different maturities. This shape of the yield curve can indicate an economic transition. The normal yield curve therefore moves towards an inverted yield curve, or vice versa. Accordingly, a flat yield curve indicates an uncertain economic situation. Due to this uncertainty, investors expect a similar yield regardless of the term. This form occurs, for example, at the end of a phase of high economic growth. If the central bank is expected to raise interest rates, the yield curve can also take on a flat shape.

The Humped Yield Curve
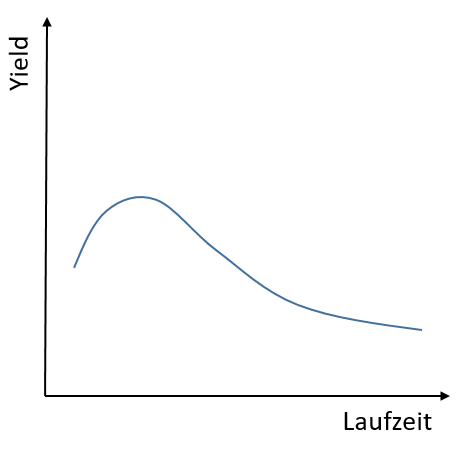
The humped yield curve initially rises with maturity. However, yields fall again with long-term maturities. This shape often reflects the uncertainty of investors.


