What is the Gini coefficient?
The Gini coefficient is a measure of income inequality in a population. The Gini coefficient can assume values between 0 and 1, whereby the inequality of income in the population increases with the value. 0 stands for perfect equality, which would mean that all inhabitants would have the same income. 1 stands for perfect inequality. In this case, this would mean that a single resident earns the entire income and all other residents earn nothing. The coefficient was developed in 1912 by the Italian statistician Corrado Gini. The Gini coefficient can be used not only for the distribution of a population’s income, but also for the distribution of wealth. The Gini coefficients for wealth are usually much higher than those for income.
The Gini coefficient only measures the distribution of income, but not the level of income in a country. Therefore, a country with a very low income can have the same Gini coefficient as a country with a very high income.
The graphical representation of the Gini coefficient
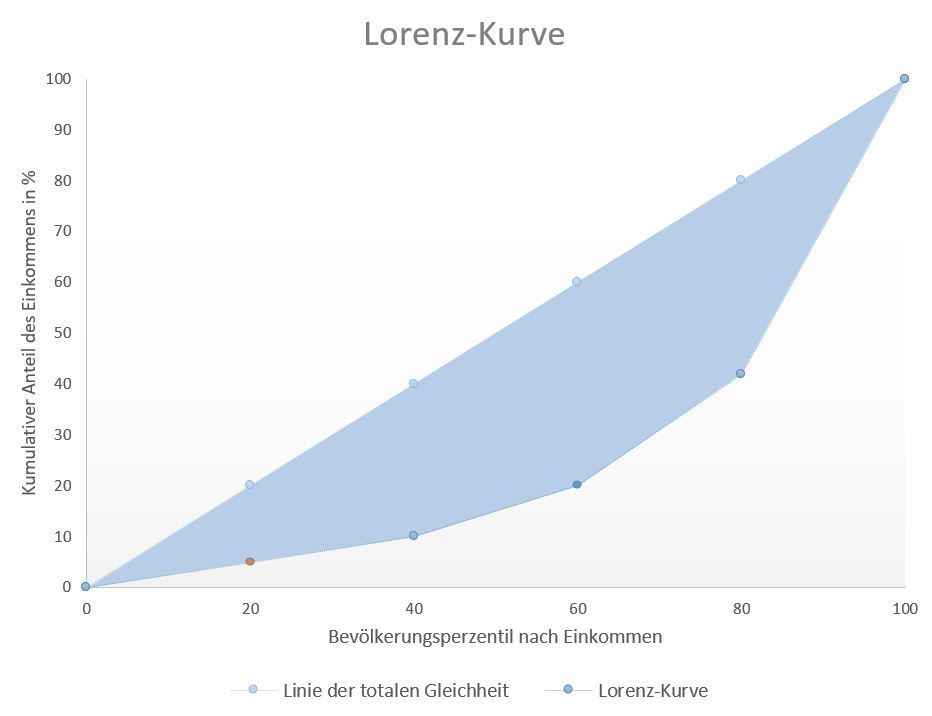
The Lorenz curve is a graphical representation of income distribution and thus the Gini coefficient. The population percentile by income is shown on the horizontal axis: You start with the lowest income. The cumulative income is shown on the vertical axis.
The figure below shows a Lorenz curve.The further away the Lorenz curve is from the line of total equality, the higher the inequality. The orange point on the Lorenz curve, for example, is read as follows: The poorest 20% of the population own 5% of the total income. If we had no inequality, the top 20% of the population would also own 20% of total income. In the illustration, the bottom 40% of the population would own 10% of the total income, and so on.
The total unequal distribution is represented by the area – the triangle – below the diagonal from bottom left to top right. This diagonal line shows the line of total equality and divides the diagram into two (0.5). The Gini coefficient is calculated by subtracting the area under the Lorenz curve from the area under the line of total equality (0.5). This gives the area between the line of total equality and the Lorenz curve, which represents the inequality (area colored blue). This area between the two lines is also called the concentration area: it shows the income concentration of a population.

Disadvantages of the Gini coefficient
The Gini coefficient can only be calculated if the gross domestic product and income data are correct. Shadow economies and informal economic activities exist in every country. In developing countries and at the lower end of the income distribution within countries, informal economic activity tends to account for a larger share of actual economic production. In both cases, this means that the Gini coefficient of measured income overstates actual income inequality. Accurate wealth data is even more difficult to obtain due to the popularity of tax havens.
In addition, very different income distributions can lead to the same Gini coefficient. The Gini coefficient only indicates the two-dimensional area, but says nothing about the shape of this area. The Lorenz curve provides more information here. However, the Lorenz curve also has its limits in terms of informative value. For example, it does not show demographic differences such as age and gender. For example, a high number of pensioners can lead to a higher Gini coefficient.
The Gini coefficient in Switzerland
The Gini coefficient in Switzerland was 0.43 for 2021, measured in terms of income before taxes and social security contributions. It has remained within a similar range over the last few decades. The Gini coefficient for disposable income is 0.29. Inequality is therefore reduced by the tax and social security system. If you compare the figures with Europe, Switzerland is in the middle of the field. In Scandinavian countries, wages are more evenly distributed, whereas in Italy, Spain and Portugal, inequality is greater.
Inequality is greater when it comes to wealth. In 2015, the wealth Gini coefficient was 0.86 . Der Wert kommt auch dadurch zustande, dass etwa ein Viertel der Haushalte über kein Vermögen verfügen. Etwa ein Drittel besitzt ein Vermögen von weniger als CHF 50’000. Den reichsten 1% gehört rund 40% des Gesamtvermögens. Die Vermögenskonzentration nimmt aber ab, wenn die Altersvorsorge berücksichtigt wird.

