What are FAANG shares?
In the financial world, the acronym “FANG” refers to the shares of four well-known American technology companies: Facebook (FB), Amazon (AMZN), Netflix (NFLX) and Alphabet (GOOG). In 2017, the company Apple (AAPL) was added, so the acronym was changed to “FAANG”. The FAANG stocks are known for their impressive growth in recent years, with each member more than doubling in value over the last five years. Each of these stocks is traded on the Nasdaq technology exchange. The FAANG stocks make up around 15% of the S&P 500, and at the beginning of March 2021, the combined market capitalization of the companies was just under USD 6 trillion. The shares are very popular with investors who like to invest in individual stocks.
Meta (Facebook)
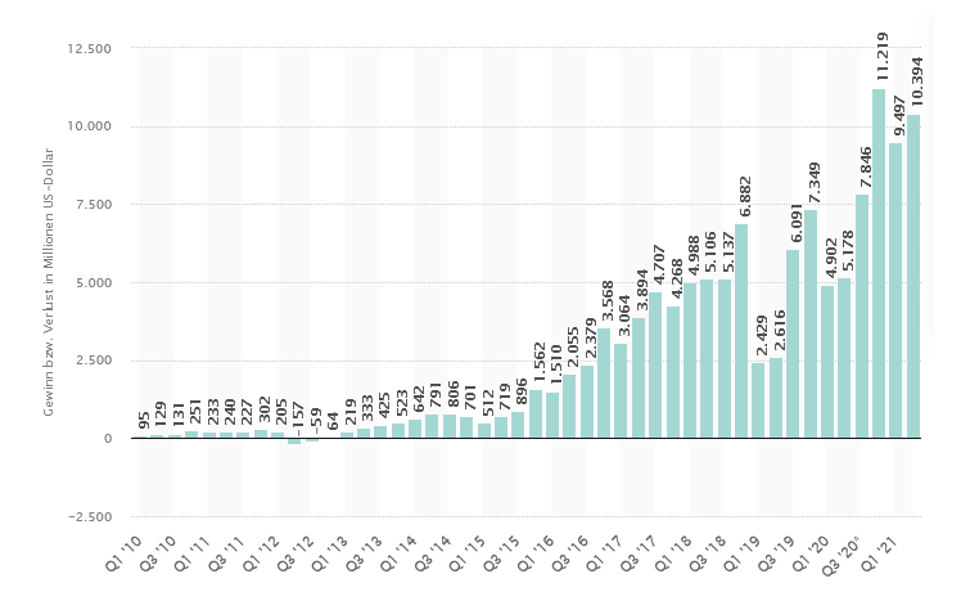
Facebook is a social networking platform. As the parent company, Meta also owns other popular social media services such as WhatsApp and Instagram. With a user base of more than 2.8 billion people (as of Q1 2021, Statista 2021), the company can claim around 30% of the world’s population as customers. Meta is mainly financed by advertising. In the 2020 financial year, the company generated revenue of just under USD 85.97 billion and a profit of USD 29.15 billion.
Profit/loss of Meta worldwide from Q1 2010 – Q2 2021, source: www.statista.com
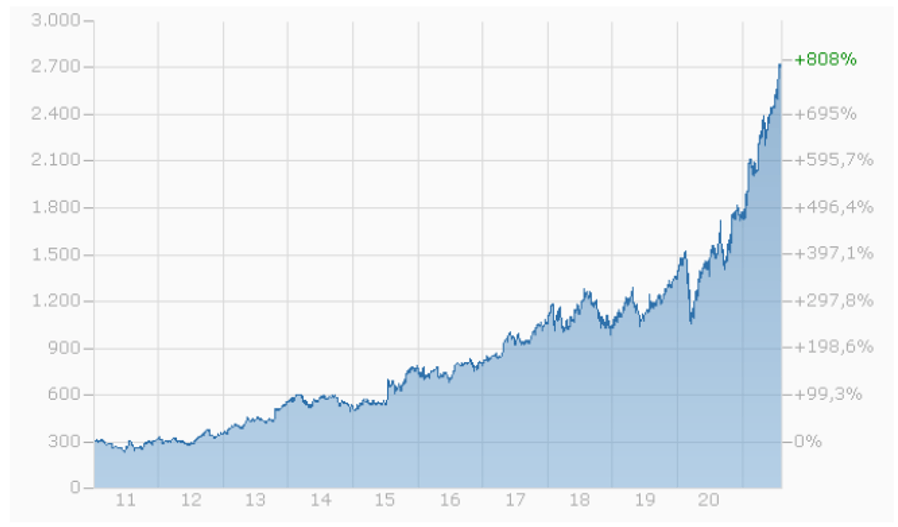
Historical prices (NASDAQ) Meta 01.01.2008-01.08.2021, source: www.finanzen.ch
Amazon
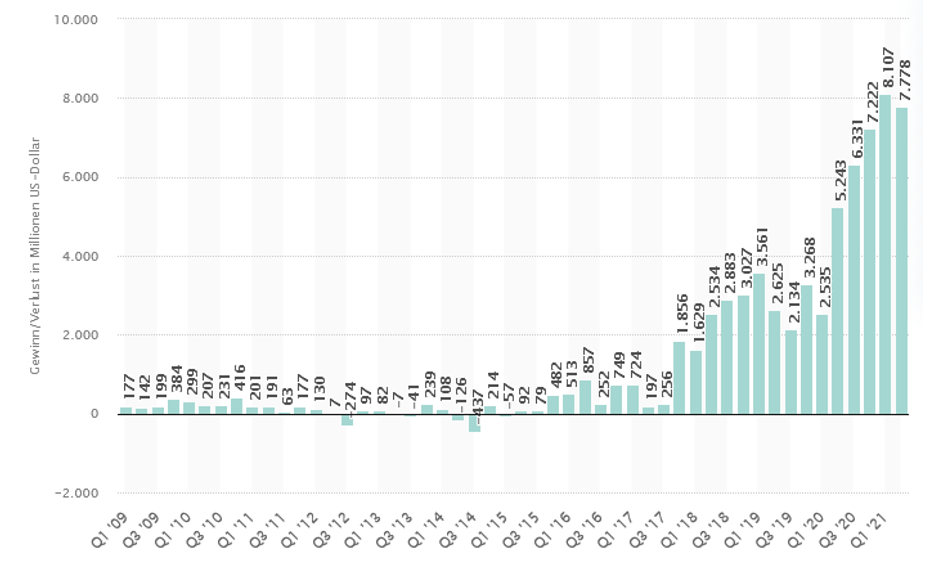
Amazon is a business-to-consumer (B2C) e-commerce platform that uses state-of-the-art cloud computing and data analytics technologies to sell a retail catalog. Amazon Prime (Amazon’s membership program with benefits such as faster and free delivery) now has over 150 million subscribers. In 2020, the company sold products to over 300 million active customers in the US alone. In 2020, Amazon generated annual sales of USD 586 billion and a net income of USD 29 billion.
Profit/loss of Amazon worldwide Q1 2009 – Q2 2021, source: www.statista.com
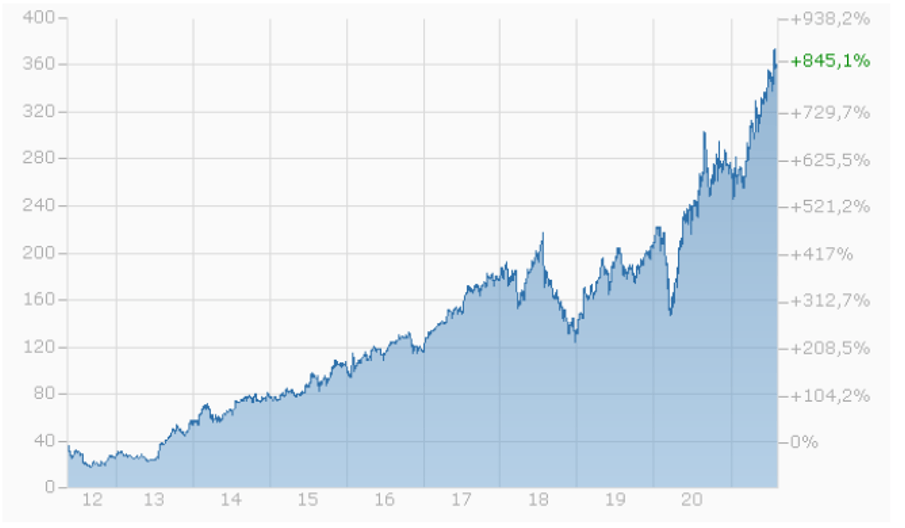
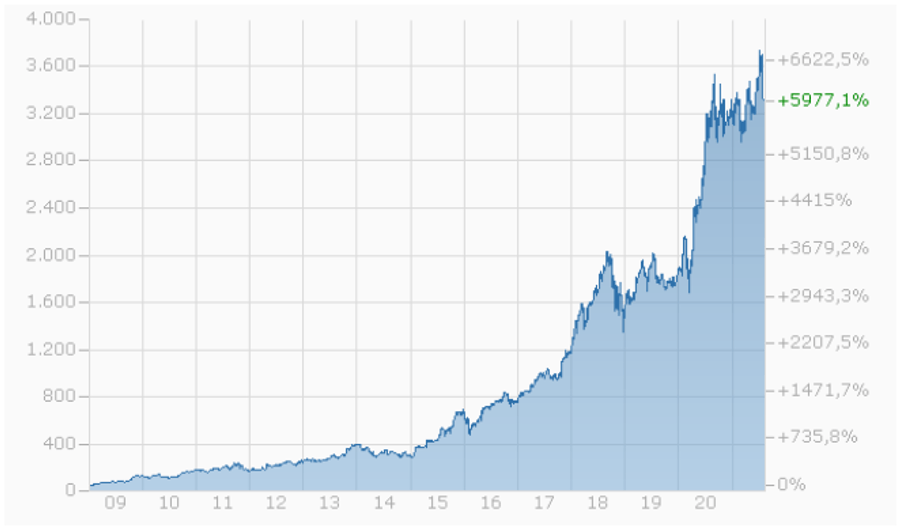
Historical prices Amazon (NASDAQ) 01.01.2009-01.08.2021, source: www.finanzen.ch
Apple
Apple is active in the fields of computers, operating systems, mobile communications and consumer electronics. Apple achieved revenue growth from around USD 8 billion (2004) to around USD 274.5 billion in 2020. Most of the revenue was generated by the iPhone. Apple is also developing new streaming and cloud computing products such as Apple Arcade and Apple Music. Total revenue in 2020 amounted to USD 274 billion.
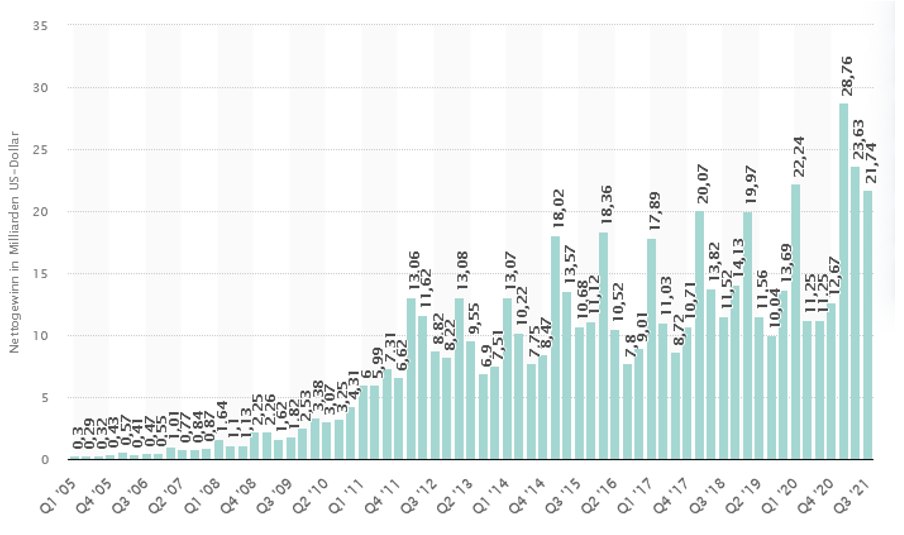
Apple Inc. profit worldwide from Q1 2005 – Q3 2021, source: www.statista.com
Historical prices Apple (NASDAQ) 01.01.2007-01.08.2021, source: www.finanzen.ch
Netflix
Netflix is an online entertainment streaming service that specializes in films and TV shows. To set itself apart from the competition, Netflix produces its own content. In recent years, the company has seen a steady growth in subscribers. Netflix is also one of the coronavirus winners. In 2020, Netflix generated total revenue of USD 25 billion. At the end of 2020, the number of subscribers exceeded 200 million for the first time.
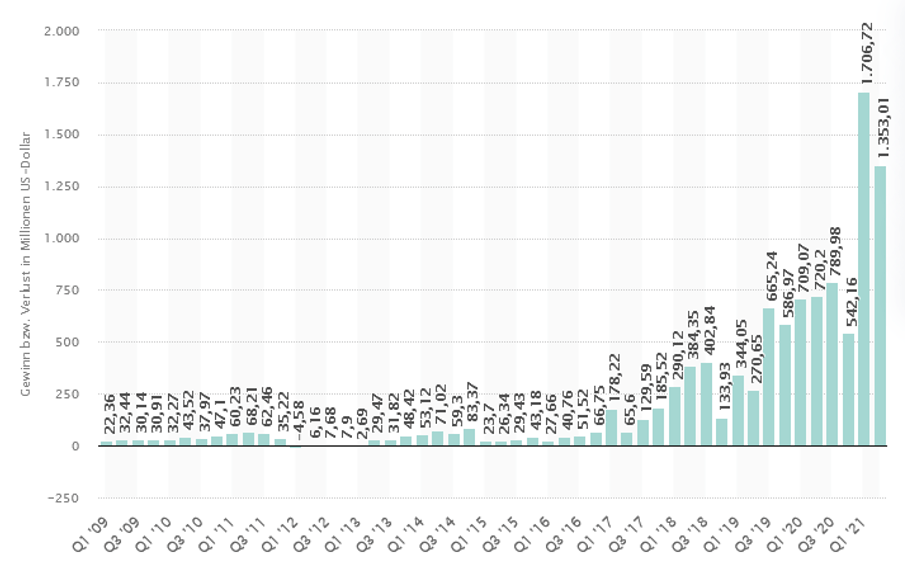
Profit/loss of Netflix Q1 2009 – Q2 2021, source: www.statista.com
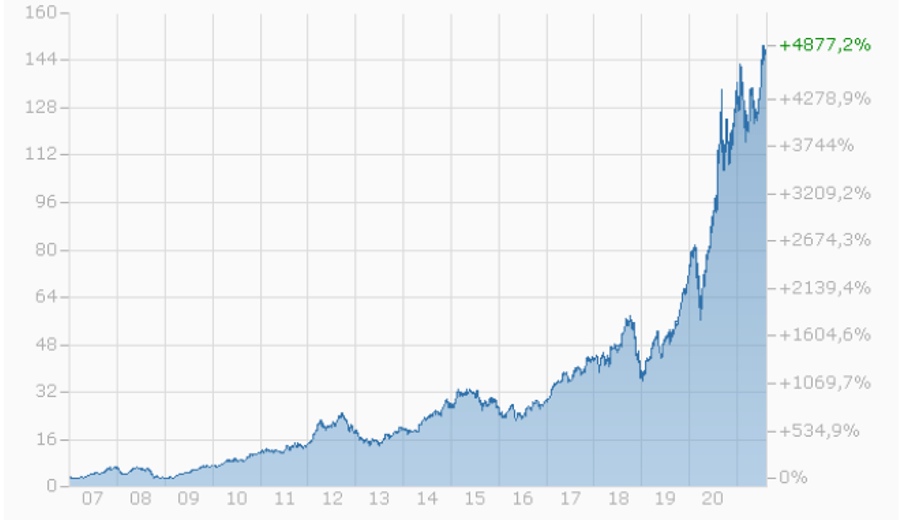
Historical prices Netflix (NASDAQ) 01.01.2007-01.08.2021, source: www.finanzen.ch
Alphabet
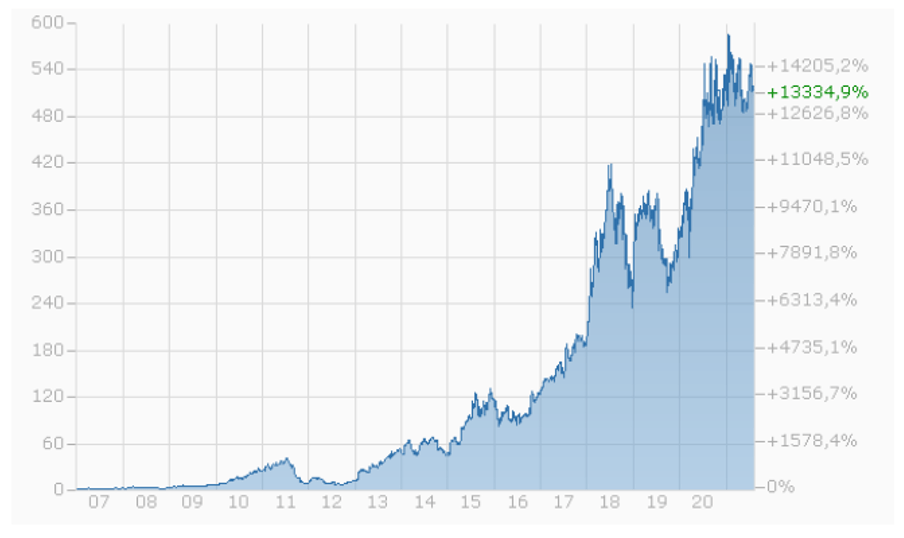
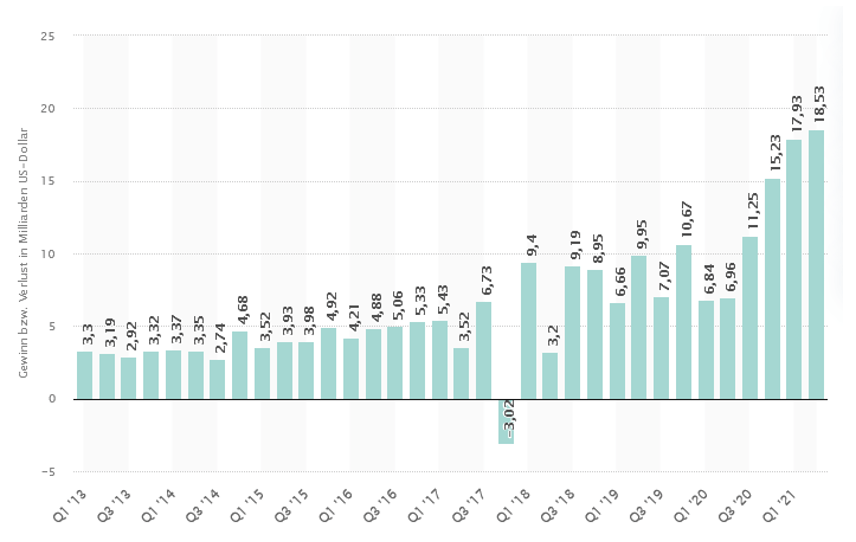
Alphabet is the parent company of Google. Alphabet is a technology conglomerate that offers a wide range of products. Nine companies (e.g. Android, Chrome, Maps, Search, Youtube, Gmail) are owned by Alphabet and each has 1 billion users. The company receives an average of over 60,000 search queries per second, and its Android mobile operating system has an estimated 75% share of the global smartphone market. In Q4 2019, market capitalization exceeded USD 1 trillion for the first time. In 2020, the company recorded total revenues of USD 182 billion.
Alphabet ‘s profit/loss from Q1 2013 – Q2 2021, source: www.statista.com
Historical prices (NASDAQ) Alphabet A shares (with voting rights) 01.01.2011-01.08.2021, source: www.finanzen.ch
