What is the 80-20 rule?
The 80-20 rule is also known as the Pareto principle. This wisdom – also known as an aphorism – states that 80% of the results come from 20% of the input. In business, one goal is therefore to identify the most potentially productive inputs and prioritize them. Focusing on these 20% is the best way to maximize benefits. This rule is only a guideline and not a mathematical law. There are hardly any scientific analyses that prove or disprove the validity of the 80-20 rule. In many situations, however, the rule is essentially valid. For example, the performance results of salespeople in a large number of companies have proven the success of the 80-20 rule.
For example, a company could generate 80% of its revenue from 20% of its customers. In this case, it makes sense to focus on these 20% of customers. This includes identifying and analyzing these customers, as well as acquiring new customers with similar characteristics. Essentially, the 80-20 rule is about identifying a company’s best resources and using them efficiently to create maximum value. Another example would be passing an exam. The focus should be on the most important parts of the subject matter. These must be identified first. The rest of the subject matter should also be learned, but due to the limited time available, the focus should be on the most important topics. Precisely because the principle is not a mathematical law, the 80-20 rule should not be interpreted as a ratio. Furthermore, it should not be assumed that other factors do not play a role. Only the most important causes should be given the most attention . It should always be borne in mind that the importance of the causes can change at any time.
History of the 80-20 rule
The 80-20 rule was first used in macroeconomics to describe the distribution of wealth in Italy at the beginning of the 20th century. In 1906, the rule was introduced by the economist Vilfredo Pareto, who is best known for his concept of Pareto efficiency. Pareto discovered the 80-20 rule when he realized that 20% of the pea pods were responsible for 80% of the peas. Finally, he showed that 80% of the wealth in Italy was owned by 20% of the population.
Joseph Juran, a Romanian-American economic theorist, discovered Pareto’s research results in 1937, around 40 years after they were published. Juran renamed the 80-20 rule “Pareto’s principle of unequal distribution”.
Juran extended Pareto’s principle to the business world to understand whether the rule could be applied to the problems of companies. He observed that in quality control departments, most production defects could be attributed to a small percentage of causes. Conversely, this means that 80% of problems are caused by only 20% of defects. The conclusion from Juran’s work is that you can make a big impact with minimal effort if you focus on eliminating this 20%.
The Pareto analysis
In general, the Pareto analysis consists of the following five steps:
- Identification of the problem.
- List or identify the cause of the problem, bearing in mind that there may be several causes.
- Prioritization of the problems, whereby the priority of the problem is weighted according to the degree of negative impact on the company.
- Organize problems into groups, e.g. customer service or system problems.
- Development of an action plan and implementation, with the highest priority problems being addressed first.
Pareto analysis is used for decision-making in business, but also has applications in many other areas. Pareto analysis is based on the 80-20 rule, i.e. the idea that 80% of the benefits of a project can be achieved through 20% of the work. Or, conversely, that 80% of the problems can be attributed to 20% of the causes. This analysis can therefore be used to prioritize. In the Pareto analysis, each problem or benefit is given a score based on its impact on the company.
Pareto analyses are used to determine which problems have the greatest impact in different departments, organizations or sectors of a company. By allocating resources to problems with higher scores, companies can use Pareto analysis to solve problems more efficiently. This allows them to focus on the problems that have the greatest impact on the company. Pareto analysis is usually used by business leaders: The approach is often based on carrying out a statistical analysis, for example a cause-and-effect analysis. This can then be used to create a list of potential problems and their consequences.
The Pareto diagram
Pareto charts can help to determine the cumulative effects of a problem. A Pareto chart contains both bars and a line chart, where the individual values are represented by bars in descending order and the cumulative sum is represented by the line. The most important problems are shown in descending order of frequency and cumulative impact.
Example of a Pareto chart
Suppose a health insurance company is losing a large part of its turnover because many customers have canceled their insurance and would like to analyze why: The health insurance company analyzes the complaints received from customers.
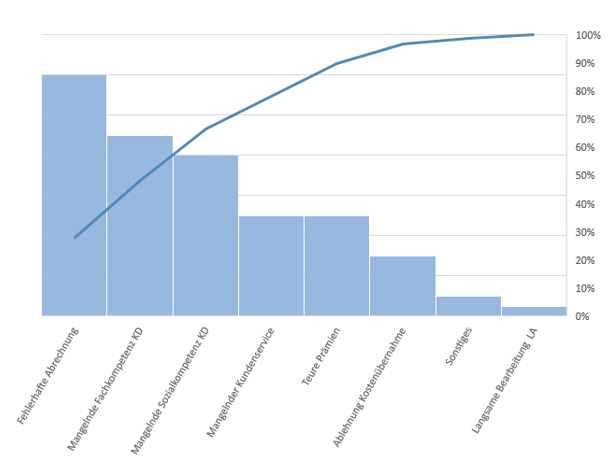
The following Pareto chart shows the number of complaints by complaint type:
The most complaints were received about incorrect benefit statements, followed by a lack of professional and social competence on the part of customer service. The company received the fewest complaints about the slow processing of benefit claims. The management has already been notified of a defect in the billing program that is responsible for the incorrect billing. The error has led to many people contacting customer service and having a bad experience. The first priority should be to process the error in the benefit statements . Customer service should then be trained. In addition, a strategy should be developed to win back the lost customers and attract new ones.


