What is the Sharpe ratio?
The Sharpe ratio is used to analyze the return of an investment in comparison to its risk. The Sharpe ratio indicates the excess return of an investment per unit of risk. The risk is measured using the standard deviation. The standard deviation indicates the price fluctuations of an asset or portfolio. In other words, the Sharpe ratio indicates the performance of a portfolio corrected for the additional risks. This makes it possible to compare high-risk investments with investments that involve comparatively lower risks. The biggest weakness of the Sharpe ratio is the assumption that investment returns are normally distributed.
The Sharpe ratio is one of the most common methods for calculating the risk-adjusted return. Modern portfolio theory (MPT) states that adding assets to a diversified portfolio with low correlations can reduce portfolio risk without sacrificing returns. The Sharpe ratio can be calculated ex-post, i.e. using historical returns, but also ex-ante using expected returns.
The formula for calculating the Sharpe ratio

Rp = portfolio return
Rf = risk-free annualized return
σp = standard deviation of the portfolio return
The numerator here is the excess return. This is calculated by subtracting the risk-free annualized return (Rf) (e.g. safe money market investment) from the annualized return (Rp) of the portfolio. The risk-free return is the return on an investment without risk, i.e. the return that investors could expect if they took no risk. The excess return is set in relation to the standard deviation of the excess return (σp) of the portfolio. The standard deviation indicates how much the portfolio’s return deviates from the expected return.
Examples for calculating the Sharpe ratio
Beispiel 1
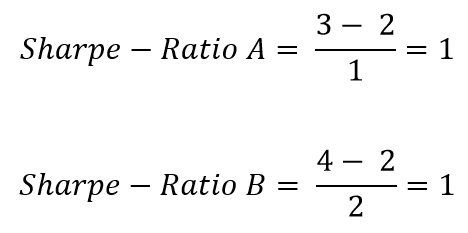
An investor would like to compare two equity funds. His asset manager compares the returns of the equity funds using the Sharpe ratio. A risk-free interest rate of 2% applies to both funds.
Equity fund 1: Within one year, equity fund 1 yields a return of 3%. The standard deviation of equity fund 1 is 1%.
Equity fund 2: Within one year, equity fund 2 yields a return of 4%. The standard deviation of equity fund 2 is 2%.
In a direct comparison, equity fund 2 earns a higher return than equity fund 1. However, by calculating the Sharpe ratio, it becomes clear that both funds are equally attractive after adjusting for risk.

Beispiel 2
An investor would like to add a new asset class to his portfolio. An asset manager advises him on this decision.
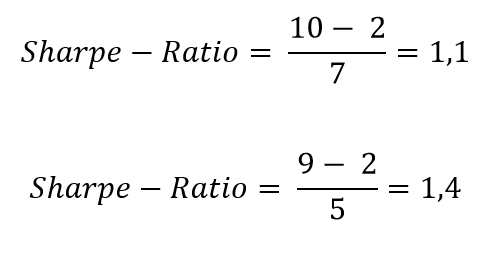
The portfolio, consisting of shares and bonds, generated a return of 10% last year. Consideration is being given to adding a fund to the portfolio. The current risk-free interest rate is 2%. Without the fund, the standard deviation of the portfolio of shares and bonds is 7%.
The asset manager explains that the inclusion of the fund will reduce the expected return of the portfolio to 9%. At the same time, however, the inclusion will reduce the standard deviation of the portfolio to 5%.
It is true that investing in the fund reduces the absolute return of the portfolio. However, a higher Sharpe ratio is calculated. The Sharpe ratio rises from 1.1 to 1.4, which means that the return is better when the risk is taken into account.

Limits of the Sharpe ratio
The Sharpe ratio uses the standard deviation of the returns in the denominator as an estimate of the overall portfolio risk, which assumes that the returns are normally distributed . This means that a large proportion of events, in this case returns, are within a certain range. In addition, the standard deviation assumes that price movements in both directions are equally risky. However, this does not correspond to reality. Returns on the financial markets deviate from the average because there are a large number of surprising price drops or peaks.
In addition, the reasons for a good return cannot be recorded. It can only be measured that the past return was good, but not why. Furthermore, the risks are not divided into systematic and unsystematic risks in the analysis. Systematic risks are risks that affect all forms of investment. Unsystematic risks are risks that relate specifically to one investment. The Sharpe ratio can be partially manipulated. This can be achieved, for example, by extending the measurement interval, which leads to a lower estimate of the standard deviation.

